 |
bostonbubble.com
Boston Bubble - Boston Real Estate Analysis
|
|
SPONSORED LINKS
Advertise on Boston Bubble
Buyer brokers and motivated
sellers, reach potential buyers.
www.bostonbubble.com
YOUR AD HERE
|
|
DISCLAIMER: The information provided on this website and in the
associated forums comes with ABSOLUTELY NO WARRANTY, expressed
or implied. You assume all risk for your own use of the information
provided as the accuracy of the information is in no way guaranteed.
As always, cross check information that you would deem useful against
multiple, reliable, independent resources. The opinions expressed
belong to the individual authors and not necessarily to other parties.
|
| View previous topic :: View next topic |
| Author |
Message |
admin
Site Admin
Joined: 14 Jul 2005
Posts: 1826
Location: Greater Boston
|
 Posted: Thu Jun 24, 2010 10:34 pm GMT Post subject: Boston Bubble Wrap: The Real Story for MA - May 2010 Posted: Thu Jun 24, 2010 10:34 pm GMT Post subject: Boston Bubble Wrap: The Real Story for MA - May 2010 |
 |
|
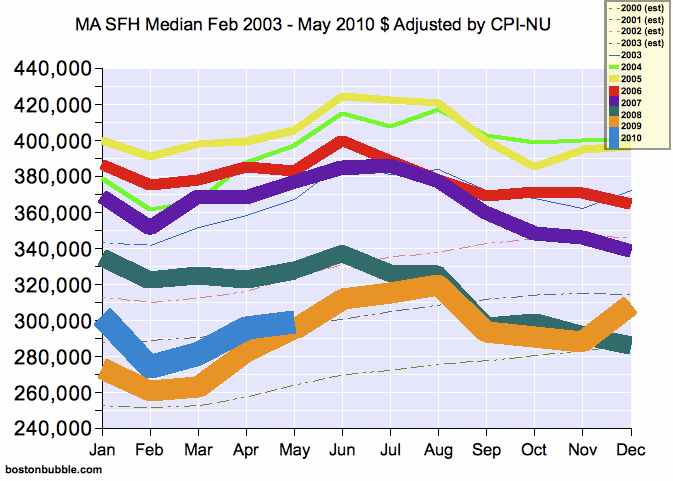
This is a brief report on what the data for the housing market in Massachusetts looks like in real terms. Market data is typically reported in nominal terms which can be misleading because it combines changes in housing values with changes in the value of the dollar. Correcting for inflation removes changes in the dollar as a factor and gives a more accurate picture of how housing values have changed. This report is based on the published data of the Massachusetts Association of Realtors, though it should be noted that the S&P/Case-Shiller Index is a superior data source.
The Massachusetts Association of Realtors released their data for May 2010 on Tuesday, June 22nd. While the raw prices were provided in nominal terms, for this report they have been adjusted for inflation using the CPI Northeast Urban numbers available at http://www.bls.gov/cpi/ Adjusting for inflation produced the data represented by the graphs below. Prices for January 2003 and earlier have been estimated by applying the earliest reported median from The MAR, February 2003, against the S&P/Case-Shiller Index for the Boston area. Suggestions for improving this estimate are welcome.
Full Price History
Change in Median Price From One Year Earlier, February 2004 - May 2010
Seasonal variations are removed by comparing prices from the same month in the prior year.
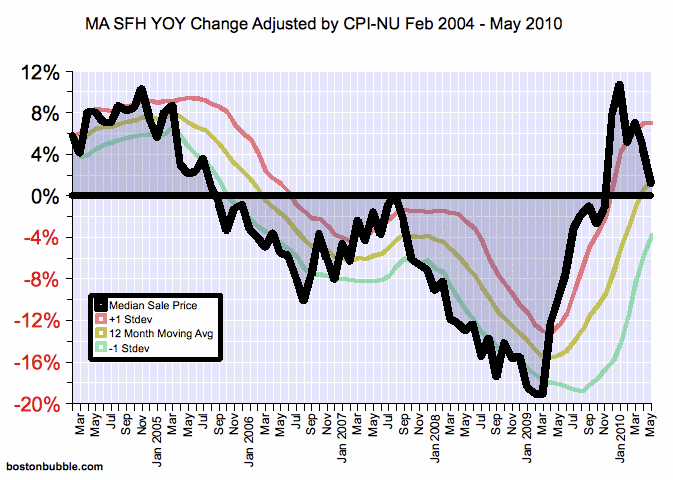
Some observations:
- The real increase from May 2009 to May 2010 was 1.34%.
- This was the sixth real year over year increase since August 2005, with all such increases occurring consecutively and after the most recent renewal and expansion of the home buyer tax credit.
- Real prices are still lower than the same month in every year in the time period covered by The MAR, with the exception of 2009.
- Prices are now 29.54% below the peak set in June 2005. This is the result of a 20.00% decline in nominal housing prices and a 11.93% decline in the purchasing power of the dollar.
- The cumulative price decline from the beginning (Feb 2003) is 12.57%, which is an annualized decline of 1.84%.
The S&P/Case-Shiller Index for Boston is likely superior to the data above as it corrects for many flaws that are inherent when using only the median price. The S&P/Case-Shiller Index also has the advantage that futures contracts can be traded against it, thereby offering an unbiased insight into where housing prices are expected to be in the future. It also has more extensive historical data available. The MAR data was used for this report mainly out of inertia and might be replaced with the S&P/Case-Shiller Index in future reports.
As usual, please do try this at home. Double checking of the math used to construct the above graphs and analysis is strongly encouraged in order to help ferret out any errors. The data was derived from the following sources:
The text of this post and the associated graphs are Copyright 2010 by bostonbubble.com with all rights reserved, except as stated here. You may reproduce each graph individually or the text of the entire post as a whole (including graphs) under the Creative Commons Attribution-No Derivative Works 3.0 Unported License. You may additionally scale the graphs to fit your work. Alternatively, if you remove the bostonbubble.com signature from the bottom left hand corner of the images within this post, those modified images (and only those modified images) can then be distributed under the Creative Commons Attribution 3.0 Unported License. In all cases, attribution should be made via a hyperlink to http://www.bostonbubble.com/forums/viewtopic.php?t=2868 or http://www.bostonbubble.com/ Quoting excerpts of the text is also allowed provided that the quotes would normally fall under fair use. To request other terms for reproduction, please post your request in the original thread at http://www.bostonbubble.com/forums/viewtopic.php?t=2868
The latest version of this report can be found at http://www.bostonbubble.com/latest.php?id=ma_inflation
- admin |
|
| Back to top |
|
 |
john p
Joined: 10 Mar 2006
Posts: 1820
|
| Posted: Fri Jun 25, 2010 1:47 pm GMT Post subject: |
|
|
Here is a good website to get a feel of the adjustment variable you're using (Inflation).
http://www.usinflationcalculator.com/index.php?s=november+2009
I noticed that October and November of 2009 saw a lift in inflation so I just punch in these months and years into the search field to see what good in the basket of goods used to determine inflation was the source of the change. It seemed that Health Care and Energy costs were driving up inflation.
When you think about that, health care and energy, that's more stuff that makes you poor. I mean if it were clothing and rent, that might be a sign of increased wages.
I guess this month I checked on this because we're getting a lot of local reports that this month's numbers for home sales are much better compared to last year. I think lots of us agree that it is the low mortgage rates and the homebuyer tax credit that are increasing affordability. What I was expecting to see was MORE of a jump in your chart. Because you adjust for inflation, I had to check to see what was going on.
It seems that energy prices "retreated" in April of 2010
http://www.usinflationcalculator.com/index.php?s=april+2010
So, help me understand the mechanics of your chart.
Take this scenario:
If median house prices stay the same, and inflation goes up 2%, your line would go down?
A lot of posters on this site were talking about oil a couple of months ago and I didn't understand why. I think that energy is the more turbulent ingredient in inflation. I wonder what else that might mean. |
|
| Back to top |
|
|
admin
Site Admin
Joined: 14 Jul 2005
Posts: 1826
Location: Greater Boston
|
| Posted: Fri Jun 25, 2010 1:59 pm GMT Post subject: |
|
|
| john p wrote: | I think lots of us agree that it is the low mortgage rates and the homebuyer tax credit that are increasing affordability.
|
I agree that these two factors have been the most dominant, but I would say they have been increasing prices, not affordability. In fact, I'd say that the tax credit actually decreased affordability because of the extra demand it created, both from extra people who bought because they considered the credit free money and from the extra people who bought during the credit period because they would not have been able to buy otherwise (Massachusetts would loan you the $8K up front for use as part of the down payment).
| john p wrote: |
What I was expecting to see was MORE of a jump in your chart. Because you adjust for inflation, I had to check to see what was going on.
|
The nominal increase wasn't that high to begin with at 4.0%. When you read local articles about the "great" May numbers in Massachusetts, it's the volume that surged, not prices.
| john p wrote: |
If median house prices stay the same, and inflation goes up 2%, your line would go down?
|
Yes, that's correct.
- admin |
|
| Back to top |
|
|
|
|
You can post new topics in this forum
You can reply to topics in this forum
You cannot edit your posts in this forum
You cannot delete your posts in this forum
You cannot vote in polls in this forum
|
Forum posts are owned by the original posters.
Forum boards are Copyright 2005 - present, bostonbubble.com.
Privacy policy in effect.
Powered by phpBB © 2001, 2005 phpBB Group
|

