 |
bostonbubble.com
Boston Bubble - Boston Real Estate Analysis
|
|
SPONSORED LINKS
Advertise on Boston Bubble
Buyer brokers and motivated
sellers, reach potential buyers.
www.bostonbubble.com
YOUR AD HERE
|
|
DISCLAIMER: The information provided on this website and in the
associated forums comes with ABSOLUTELY NO WARRANTY, expressed
or implied. You assume all risk for your own use of the information
provided as the accuracy of the information is in no way guaranteed.
As always, cross check information that you would deem useful against
multiple, reliable, independent resources. The opinions expressed
belong to the individual authors and not necessarily to other parties.
|
| View previous topic :: View next topic |
| Author |
Message |
admin
Site Admin
Joined: 14 Jul 2005
Posts: 1826
Location: Greater Boston
|
 Posted: Fri Jan 26, 2007 3:51 am GMT Post subject: Boston Bubble Brief: The Real Story for MA - December 2006 Posted: Fri Jan 26, 2007 3:51 am GMT Post subject: Boston Bubble Brief: The Real Story for MA - December 2006 |
 |
|
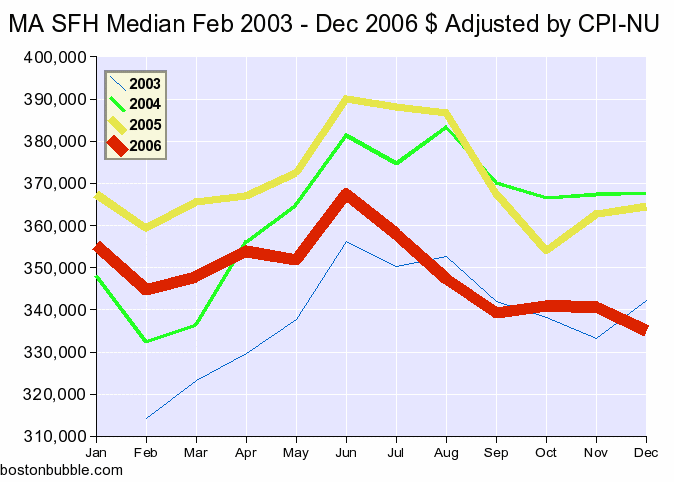
This is a brief report on what the data for the housing market in Massachusetts looks like in real terms. Market data is typically reported in nominal terms which can be misleading because it combines changes in housing values with changes in the value of the dollar. Correcting for inflation removes changes in the dollar as a factor and gives a more accurate picture of how housing values have changed. Reports are based on the published data of the Massachusetts Association of Realtors.
The Massachusetts Association of Realtors released their data for December 2006 on Thursday, January 25th. While the raw prices were provided in nominal terms, for this report they have been adjusted for inflation using the CPI Northeast Urban numbers available at http://www.bls.gov/cpi/ Adjusting for inflation produced the data represented by the graphs below:
Full Price History
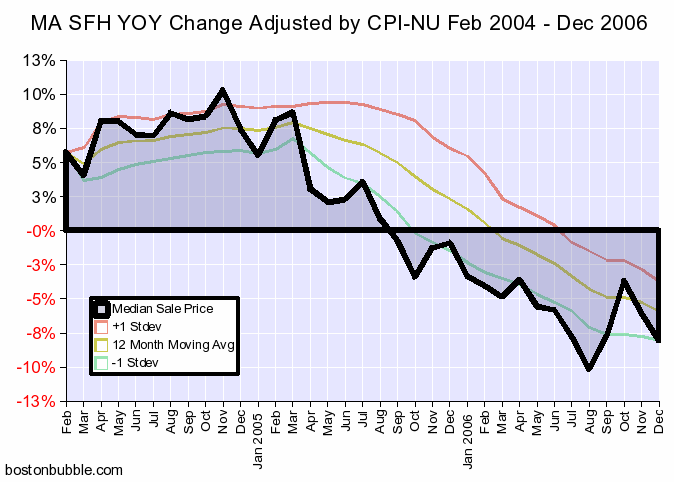
Change in Median Price From One Year Earlier, February 2004 - December 2006
Seasonal variations are removed by comparing prices from the same month in the prior year.
Some observations:
- The real decline from December 2005 to December 2006 was 8.09%.
- Prices are now 14.12% below the peak set in June 2005.
- Prices are once again below 2003 levels.
- The moving average for year over year declines is well over two (and close to three) standard deviations below 0, indicating that declines are the norm. In fact, the price change for December was almost four standard deviations below 0.
- The rate of decline is continuing to accelerate as evidenced by the fact that the year over year change in December was over one standard deviation below the moving average. In other words, the situation is continuing to worsen (for sellers) not just from continued price declines, but also from the individual declines continuing to grow larger. Phrased yet another way, the first and second derivatives are both negative.
As in previous months, The Warren Group once again reported greater declines than The Massachusetts Association of Realtors. The Warren Group reported declines on equivalent transactions of 8.1%, with the median price falling to $310,000 in November 2006. This translates to a real decline of 10.7%. The Warren Group's data is more comprehensive than the Massachusetts Association of Realtors' data as it includes all sales rather than just Realtor affiliated MLS sales.
As usual, please do try this at home. Double checking of the math used to construct the above charts and analysis is strongly encouraged in order to help ferret out any errors. The data was derived from the following sources:
The text of this post and the associated graphs are Copyright 2006 by bostonbubble.com with all rights reserved, except as stated here. You may reproduce each graph individually or the text of the entire post as a whole (including graphs) under the Creative Commons Attribution-NoDerivs 2.5 License. You may additionally scale the graphs to fit your work. Alternatively, if you remove the bostonbubble.com signature from the bottom left hand corner of the two images within this post, those modified images (and only those modified images) can then be distributed under the Create Commons Attribution 2.5 License. In all cases, attribution should be made via a hyperlink to http://www.bostonbubble.com/forums/viewtopic.php?t=186 or http://www.bostonbubble.com/ Quoting excerpts of the text is also allowed provided that the quotes would normally fall under fair use. To request other terms for reproduction, please post your request in the original thread at http://www.bostonbubble.com/forums/viewtopic.php?t=186
- admin |
|
| Back to top |
|
 |
samchady
Guest
|
| Posted: Sat Jan 27, 2007 5:41 pm GMT Post subject: Question on chart graphics |
|
|
Why do you shade underneath the YOY change graph? You are not showing an area, but a delta which is a single point. I guess the reason I ask is that your final vertical lines on Feb 2004 and Dec 2006 confused me at first because it looks like you are plotting the data back to zero. You can't have a vertical line on this type of plot because its showing a range instead of a datum point.
If you like to shade it to have this line show up better, I would suggest a bar chart perhaps? Or at least delete the final vertical lines at the start and end.
Or perhaps I am confused here and you are correct? Or maybe I am being too picky and it was for artistic reasons. It does look fantastic by the way.
Thanks for all your work! |
|
| Back to top |
|
|
admin
Site Admin
Joined: 14 Jul 2005
Posts: 1826
Location: Greater Boston
|
| Posted: Sat Jan 27, 2007 8:00 pm GMT Post subject: |
|
|
samchady,
The intent of the shading was purely artistic. Technically, the area might actually have some meaning related to accumulated prices, but the black line is meant to be the important part.
I don't like the vertical segments at the endpoints either, but I ran out of time trying to figure out how to get rid of them last time I tried. The graphs are built using OpenOffice.org Calc in case you, or anybody has, can recommend how to remove the vertical segments.
- admin |
|
| Back to top |
|
|
bubbles
Guest
|
| Posted: Mon Jan 29, 2007 1:47 pm GMT Post subject: Boston vs MA |
|
|
| My friends are buying condos in Boston and continue to claim the market there is strong...how different would these numbers look for Boston instead of admittedly weak MA as a whole? Thanks. |
|
| Back to top |
|
|
admin
Site Admin
Joined: 14 Jul 2005
Posts: 1826
Location: Greater Boston
|
| Posted: Mon Jan 29, 2007 2:07 pm GMT Post subject: |
|
|
| Quote: |
My friends are buying condos in Boston and continue to claim the market there is strong...how different would these numbers look for Boston instead of admittedly weak MA as a whole? Thanks.
|
Here is a breakdown on another site of Boston condos by neighborhood:
http://masshousemarket.blogspot.com/2007/01/boston-urban-core-condo-market.html
Bear in mind, it is not adjusted for inflation. That said, the decline is hitting this "urban core market," although it would seem not as dramatic of a drop yet. That is probably at least partially due to the use of nominal amounts. The other important difference to consider is that the graphs in this thread are just for single family homes - if you were actually to use the MAR's condo data instead and create the same type of graphs, I suspect that would be pretty close to what you're looking for since most condos in Massachusetts are probably in the metro Boston area (that is just a guess though, and I could be wrong).
In the greater scheme of things, this is an incomplete picture. You also need to know how rents and incomes compare to property prices for the area. In my opinion, that tells you where prices need to be, and these monthly price declines just show you how much progress has been made so far. A slower rate of decline for a particular area is actually a bad thing because it just drags the inevitable out much longer.
- admin |
|
| Back to top |
|
|
SamChady
Guest
|
| Posted: Mon Jan 29, 2007 2:21 pm GMT Post subject: Boston Condos |
|
|
Although my experience more anecdotal, I am specifically looking at the MLS listings for Boston in the North End and Back Bay area, everything under $400K. I also look in Central Square and Harvard Square areas, everything under $400K. Most of those properties have been on the market for over 6 months, with steady (but very small) price drops. When a property actually sells, its usually one that is priced low and goes quickly. I have been doing this since mid last year.
I have gone and looked at many of the properties, and I heard from the selling agents that their sellers are unrealistic and driving them crazy (my agent engages them in conversation and I pretend not to be listening). Some of the condo's have sold, but most have been removed with no way of knowing what happened, but I suspect they have been rented out.
There is one condo that promised to drop its price $5K a week until it sold. After 4 weeks, that promise "mysteriously" was removed from the listing, and it sits at $199.5K. The place is a wreck in a unkempt absentee landlord neighborhood.
So I don't see this - the same properties I was interested in 6 months ago are still on my list, or have been taken down and put back up as new, with price drops so small its laughable. The other thing I see is a dramatic price difference between extremely similar properties. As much as 20% higher prices on the same exact places, and the cheaper ones are still not selling.
My agent finally admitted the truth to me, that he has not made very many deals, and those that he has made are on properties that are going at least 20% less than the pricing of the others on the market. |
|
| Back to top |
|
|
guest type
Guest
|
|
| Back to top |
|
|
admin
Site Admin
Joined: 14 Jul 2005
Posts: 1826
Location: Greater Boston
|
| Posted: Thu Feb 01, 2007 7:39 pm GMT Post subject: |
|
|
| Quote: |
Did you know your graph is up on the Housing bubble page on wikipedia?
|
Yes. The Creative Commons licensing was actually added at their request.
Thanks,
- admin |
|
| Back to top |
|
|
|
|
You can post new topics in this forum
You can reply to topics in this forum
You cannot edit your posts in this forum
You cannot delete your posts in this forum
You cannot vote in polls in this forum
|
Forum posts are owned by the original posters.
Forum boards are Copyright 2005 - present, bostonbubble.com.
Privacy policy in effect.
Powered by phpBB © 2001, 2005 phpBB Group
|

