 |
bostonbubble.com
Boston Bubble - Boston Real Estate Analysis
|
|
SPONSORED LINKS
Advertise on Boston Bubble
Buyer brokers and motivated
sellers, reach potential buyers.
www.bostonbubble.com
YOUR AD HERE
|
|
DISCLAIMER: The information provided on this website and in the
associated forums comes with ABSOLUTELY NO WARRANTY, expressed
or implied. You assume all risk for your own use of the information
provided as the accuracy of the information is in no way guaranteed.
As always, cross check information that you would deem useful against
multiple, reliable, independent resources. The opinions expressed
belong to the individual authors and not necessarily to other parties.
|
| View previous topic :: View next topic |
| Author |
Message |
admin
Site Admin
Joined: 14 Jul 2005
Posts: 1826
Location: Greater Boston
|
 Posted: Thu Oct 15, 2015 6:36 pm GMT Post subject: Boston housing inventory trends Jan 2011 - Aug 2015 Posted: Thu Oct 15, 2015 6:36 pm GMT Post subject: Boston housing inventory trends Jan 2011 - Aug 2015 |
 |
|
Currently, anemic inventory is one of the two main factors dominating the Boston real estate market, skewing it heavily toward sellers. (The other factor essential to sustaining current real prices is historically low mortgage rates.) Prospective buyers would benefit from knowing when inventory will improve. That may not be any more predictable than when mortgage rates will change, but perhaps a simpler question whose answer would also provide value is whether inventory is currently improving.
Answering whether inventory is currently improving is tractable, but the answer won't be obvious from the numbers typically reported. There is a high degree of seasonality to inventory availability, and so a decline in inventory this month compared to last month might actually be an improvement if the decline is less than normal. Comparing inventory for a given month to the same month a year earlier would be one way factor out seasonality, and that is sometimes done in news articles. However, that doesn't provide insight into what level of inventory is normal and is also susceptible to noise from the anomalies for a particular year, such as Boston's mini ice age at the beginning of 2015.
As a first attempt at working out a way to better monitor inventory so that a change in the trend can be spotted more easily, I've converted Zillow's inventory data for the Boston MSA into a seasonally adjusted series. The conversion is simplistic, and if there are suggestions for improvements, please post them. For each month, I adjusted the raw inventory number by the percentage of inventory that the same month represented in all prior years. Below is a graph of the results from January 2011 - August 2015.
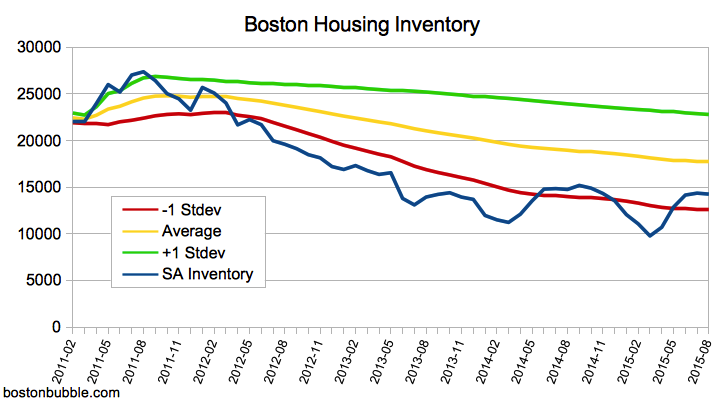
The graph above would suggest that inventory is bad and not improving. On the plus side, it also appears to no longer be deteriorating. It peaked in August 2011 and then began a multi-year descent. It almost bottomed out in March 2014 but then hit a new low again in March 2015, quite possibly due to the mini ice age we lived through at the beginning of the year.
The depth of the data is unfortunately lacking. It only begins in 2010 and is completely dominated by the slide. Suggestions for additional data sources are welcome.
- admin |
|
| Back to top |
|
 |
Richthofen
Joined: 02 Apr 2014
Posts: 69
|
| Posted: Sat Oct 17, 2015 6:59 pm GMT Post subject: |
|
|
Good analysis. This mirrors antecdotally what many people who are looking for houses are seeing; that housing inventory continues to trend down.
I'd be interested to know what is keeping inventory off the market. We were told that boomers would be downsizing the next 10+ years, but that does not appear to be happening. Given that housing prices have surpassed the previous peak the 'move up' buyer should have been freed (but apparently is not). Are people still underwater from the last bubble? I am trying to put the story together.
Do we have data from the last downtrend and re-uptrend in real estate (the late 80s condo crash)? |
|
| Back to top |
|
|
admin
Site Admin
Joined: 14 Jul 2005
Posts: 1826
Location: Greater Boston
|
| Posted: Thu Oct 22, 2015 4:07 pm GMT Post subject: |
|
|
I wish I knew what the story was. One thing I have heard from prospective "move up" buyers is that they can't sell because they wouldn't have anywhere to go as nothing is available. So it could be gridlock. Lack of inventory might also partly explain why boomers aren't downsizing. In addition, I think many boomers have delayed plans for retirement (including moving) out of financial necessity - many haven't saved enough and those that did save what could have been enough historically are probably being held back by the decimation of bond yields.
I don't know of a source for Boston inventory that goes back to the 1980s. If anybody else knows of a source, please post here.
Here is some inventory data that goes back to April 2006:
http://www.deptofnumbers.com/asking-prices/massachusetts/boston/
I, or somebody, should chain it to the Zillow data. That would improve the seasonality adjustment and also improve the calculation of the average range. Maybe I'll do that when Zillow releases their data for September.
- admin |
|
| Back to top |
|
|
|
|
You can post new topics in this forum
You can reply to topics in this forum
You cannot edit your posts in this forum
You cannot delete your posts in this forum
You cannot vote in polls in this forum
|
Forum posts are owned by the original posters.
Forum boards are Copyright 2005 - present, bostonbubble.com.
Privacy policy in effect.
Powered by phpBB © 2001, 2005 phpBB Group
|

